When the Average Looks Fine… but the System Isn’t
Most dashboards report the mean. On the surface, everything appears stable. But most real-world failures do not live in the average. They live in the distribution.
This pattern appears everywhere, from business metrics to machine learning systems. The headline number stays flat, while the underlying behavior quietly shifts. By the time the average moves, the system has often already degraded.
The Illusion of Stability
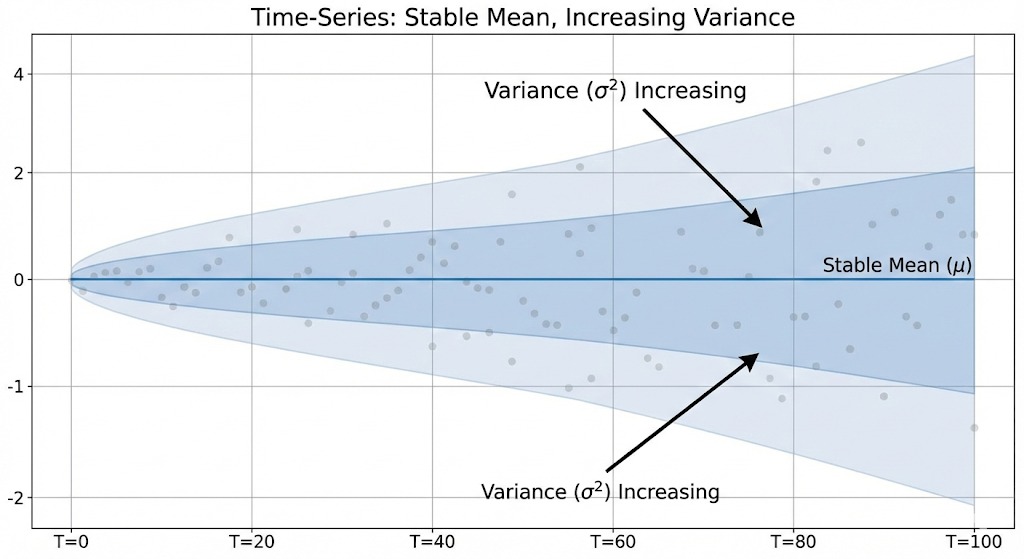
In real data and AI systems, stability is often assumed because the mean remains constant. However, variance can increase, distributions can widen, and tails can grow heavier, all while the average looks perfectly normal.
This is exactly how many production issues begin. Risk increases silently, but dashboards continue to report healthy numbers.
Why Averages Fail in Real Systems
Several critical signals are consistently overlooked when systems rely too heavily on averages.
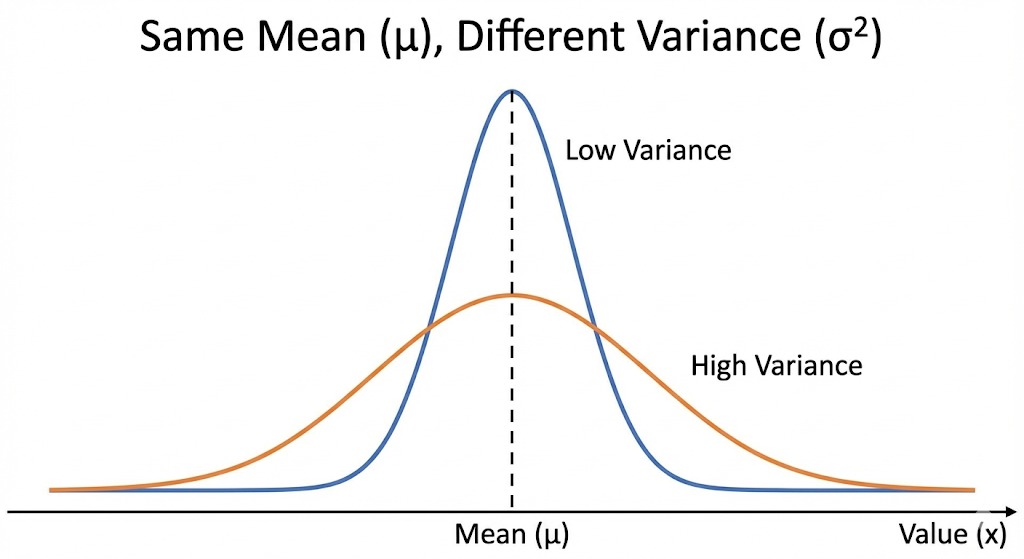
- Same mean, different distributions. Two systems can share the same average while having completely different risk profiles. Higher variance means higher uncertainty, even if the mean does not change.
- Averages collapse behavior. Outliers and tail events are often where the real-world impact lives. By averaging them away, we lose the most important information.
- Time matters more than snapshots. Single-point metrics hide drift. Rolling windows and temporal features reveal change long before KPIs move.
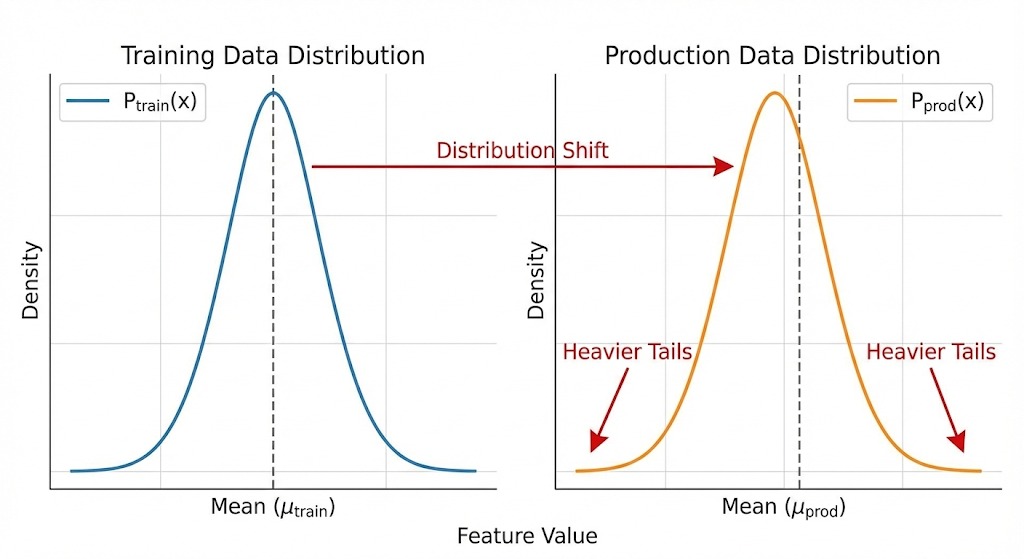
- Models inherit data assumptions. If training data ignores variance and tail behavior, production failures appear “unexpected” even though the signals were present.
- Decisions degrade before metrics do. Systems often become fragile long before dashboards react. By the time alerts fire, options are limited.
Implications for Data and AI Systems
AI in production is not about predicting the average outcome. It is about understanding how behavior spreads, shifts, and concentrates over time.
This requires looking beyond single metrics and focusing on distributions, temporal behavior, and tail risk. Without this perspective, models appear accurate until they fail in ways that feel sudden but were actually gradual.
Asking Better Questions
Good analytics does not stop at asking, “What is the number?” It asks, “How is the system behaving?”
That shift in thinking is what separates dashboards from decision systems, and monitoring from real understanding.
Curious how others think about variance and distribution shifts in real-world data systems.
– Pathum Dilshan


Comments
Post a Comment