Anomaly Detection in Daily KPI Monitoring: A Data Engineering View from Real Systems
Daily KPI monitoring is often misunderstood as watching dashboards and reacting to alarms. In real production environments, especially large-scale networks and data platforms, the real challenge lies in detecting subtle changes early, before users feel the impact.
In practice, anomalies rarely appear as clean failures. They emerge quietly, as small statistical deviations buried inside time-series data. By the time a KPI crosses a hard threshold, the system has often already been degraded for some time.
Effective anomaly detection sits at the intersection of data engineering foundations, mathematical modeling, and domain understanding. Ignoring any one of these leads to noisy alerts, missed signals, or delayed responses.
The Data Engineering Foundation Comes First
Before any detection logic is applied, the data itself must be trustworthy. This is the most overlooked part of anomaly detection.
Production KPIs must be collected at consistent intervals, aligned across sources, and aggregated using stable time windows. Missing values, late-arriving data, and inconsistent sampling distort baselines and produce false alarms, regardless of how advanced the detection model is.
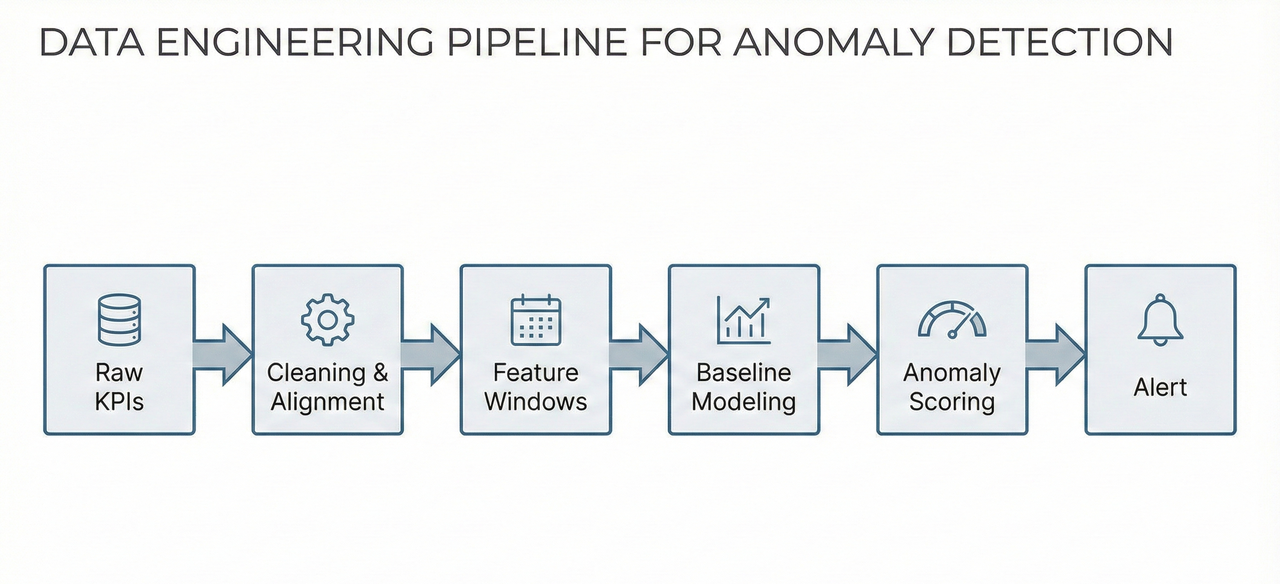
In real systems, anomaly detection is not a single algorithm. It is a pipeline:
Raw KPIs → Cleaning & Time Alignment → Feature Windows → Baseline Modeling → Anomaly Scoring → Alerting
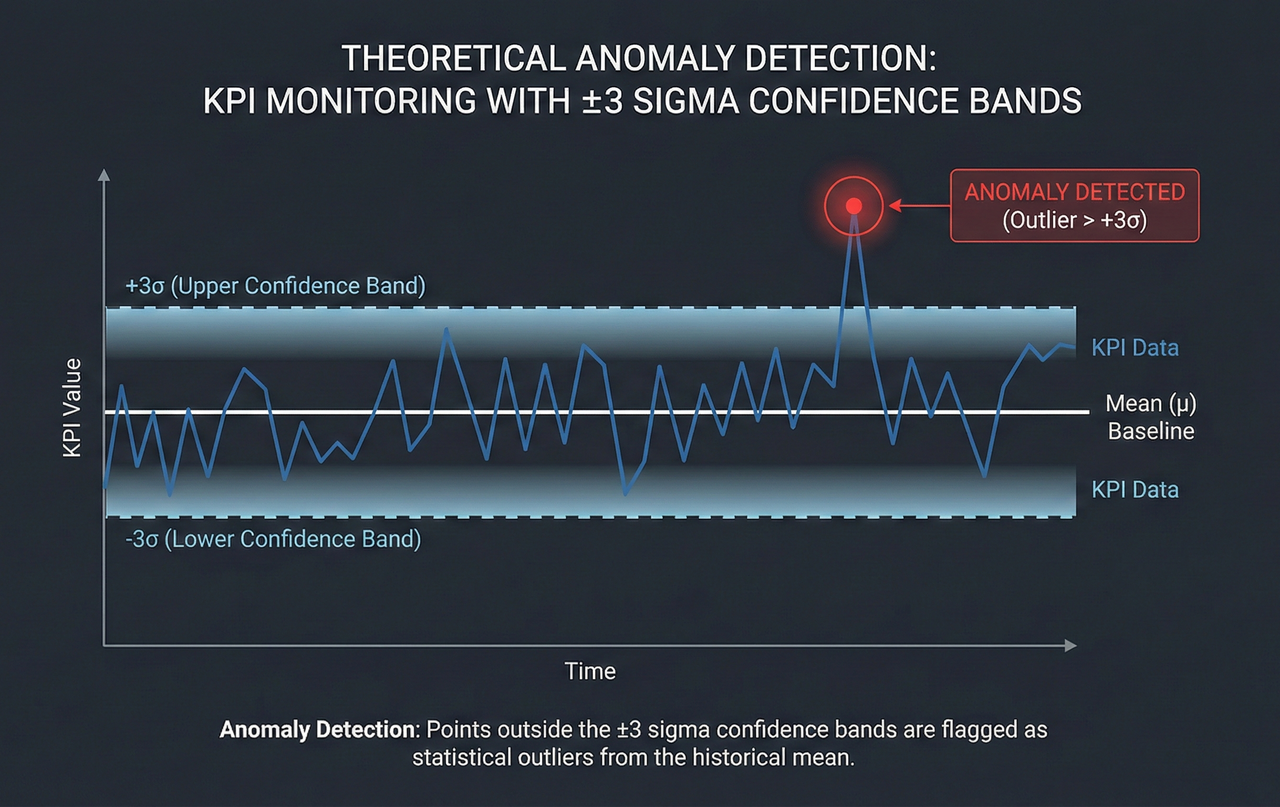
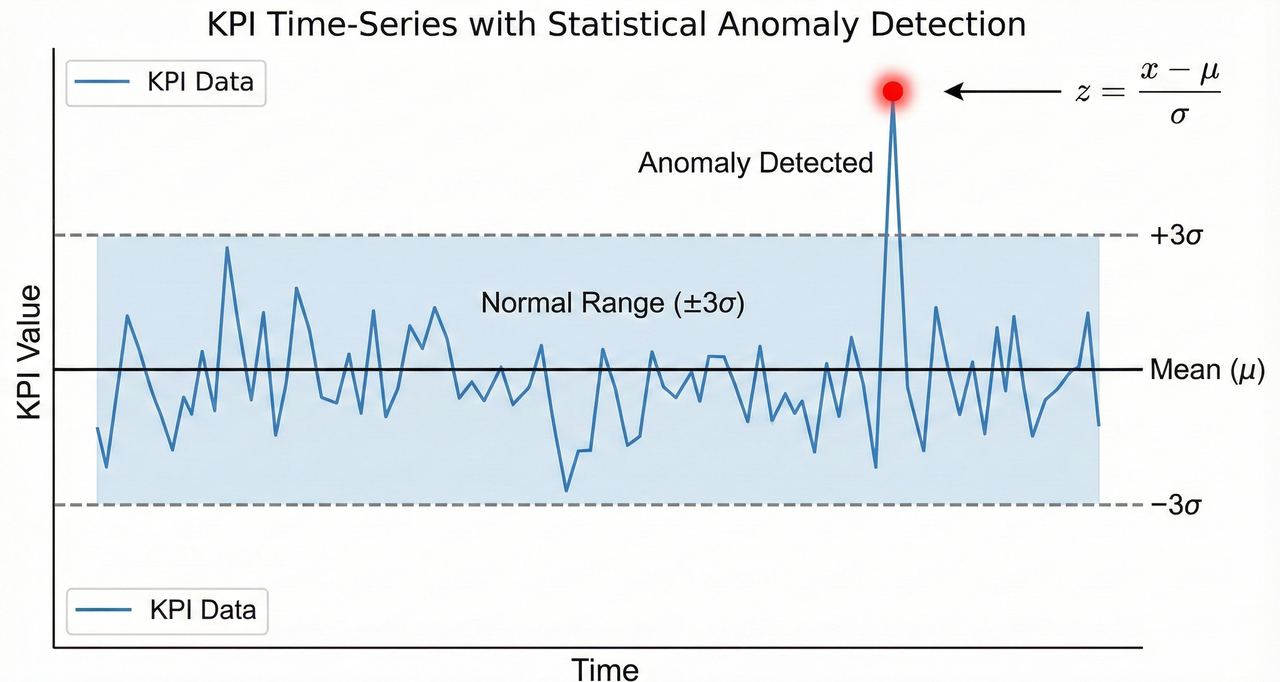
Statistical Thresholds and the Z-Score Principle
One of the most widely used and interpretable techniques in anomaly detection is statistical deviation from a baseline.
A rolling mean defines expected behavior:
μₜ = (1 / N) Σ KPIₜ₋ᵢ
Deviation is quantified using a Z-score:
zₜ = (KPIₜ − μₜ) / σₜ
When the absolute value of z exceeds a chosen threshold, commonly 2 or 3, the data point is flagged as anomalous.
Despite its simplicity, this method is extremely effective for detecting abrupt events such as sudden interference, sharp throughput drops, or hardware-related KPI collapses. Its strength lies in explainability, which is critical in operational environments.
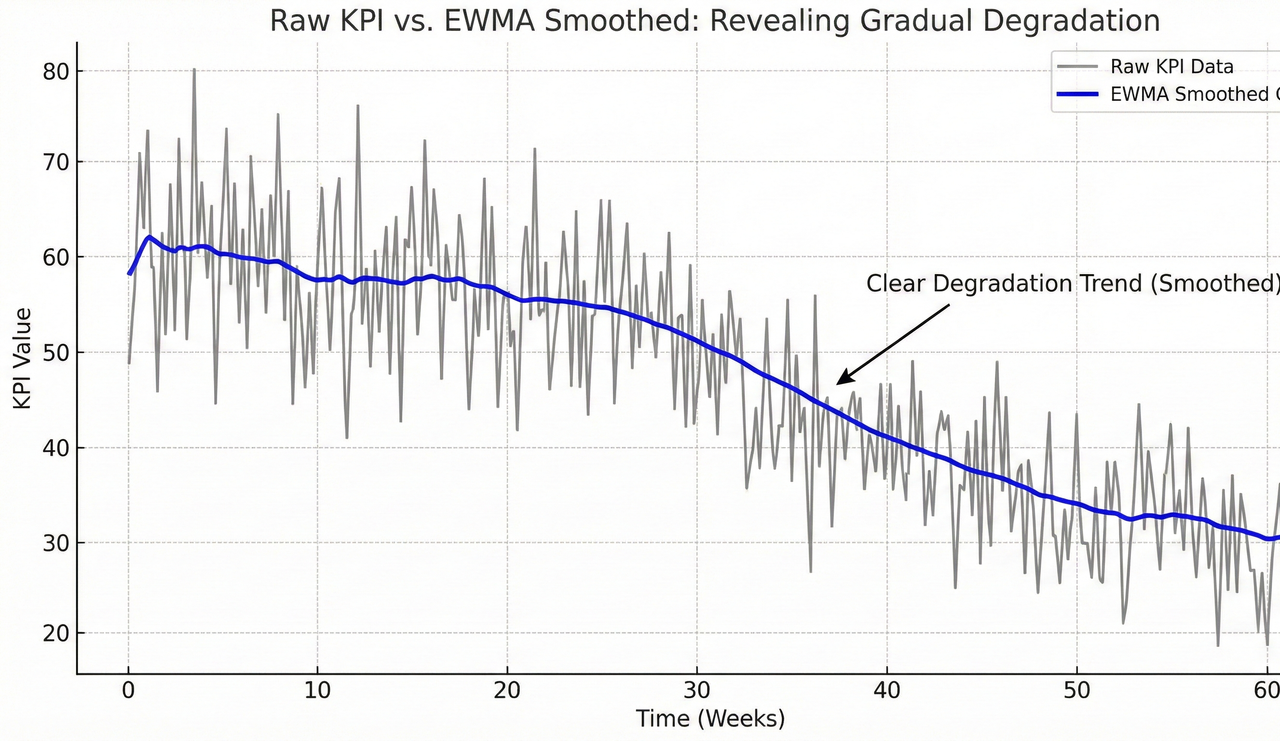
Slow Degradation and the Role of EWMA
Not all problems arrive as spikes. Some of the most damaging issues manifest as gradual degradation, slowly eroding performance while remaining under static thresholds.
Exponential Weighted Moving Average (EWMA) captures these patterns:
Sₜ = α · KPIₜ + (1 − α) · Sₜ₋₁
By adjusting the smoothing factor α, engineers control sensitivity to recent changes. EWMA reduces noise while preserving trends, making it effective for identifying slowly rising latency, gradual SINR degradation, or creeping error rates.
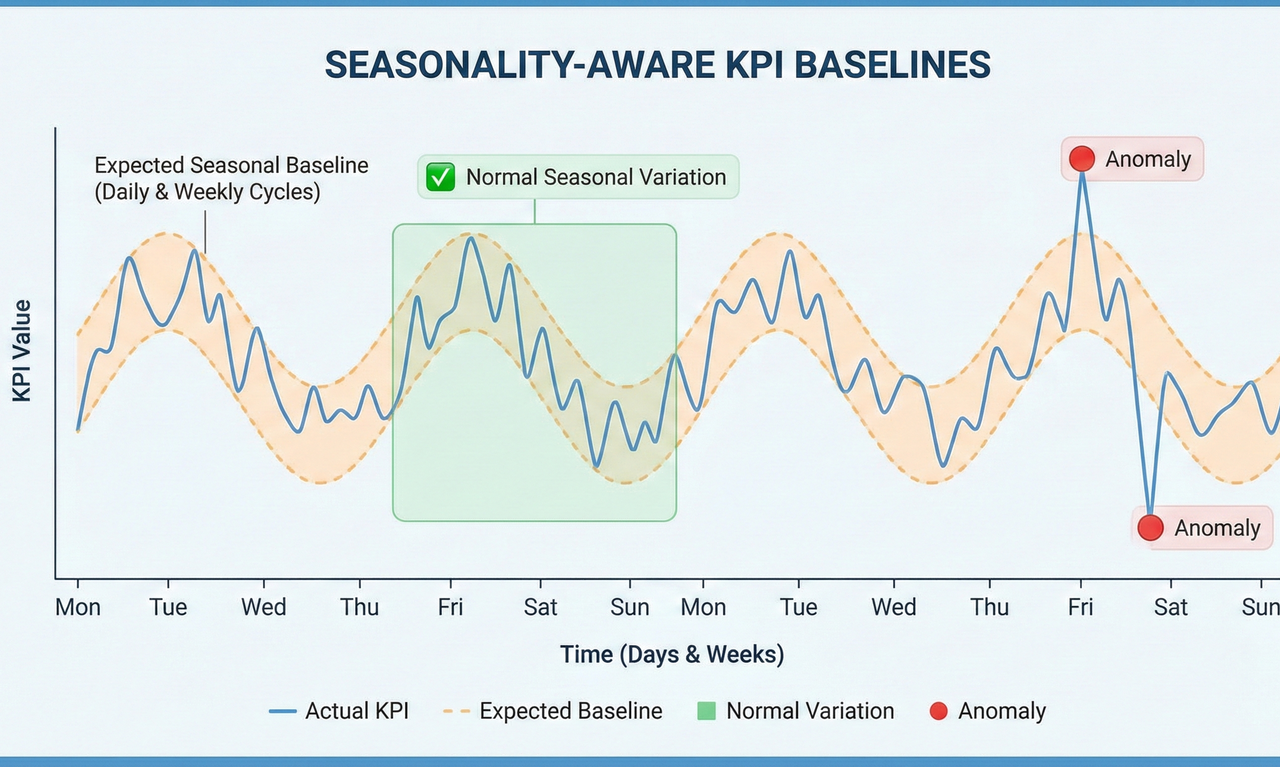
Why Seasonality Awareness Is Non-Negotiable
Most KPIs exhibit strong temporal patterns. Daily peaks, weekly cycles, and recurring behavior are normal in healthy systems.
Ignoring seasonality leads directly to alert fatigue. Seasonality-aware baselines model expected behavior per time context, allowing detection logic to adapt to natural fluctuations.
Machine Learning for High-Dimensional Behavior
As systems scale, KPIs stop behaving independently. Metrics become correlated, and failures manifest as complex patterns across multiple dimensions.
Isolation Forests identify rare patterns in high-dimensional KPI space, while Autoencoders learn normal behavior and flag deviations based on reconstruction error.
These methods excel at detecting cross-KPI anomalies and compound degradation, but they are only effective when supported by strong data engineering foundations.
Context Is the Final Filter
Mathematics and machine learning can detect anomalies, but they cannot judge impact.
Planned changes, traffic surges, topology shifts, and external events all influence KPI behavior. Engineering intuition transforms anomaly scores into real decisions.

Closing Thoughts
Effective anomaly detection is not defined by one algorithm. It is defined by a system.
When data engineering fundamentals, statistical reasoning, machine learning, and domain expertise work together, KPIs evolve from passive metrics into early warning mechanisms.
This is where data engineering stops being theoretical and starts creating real operational value.
– Pathum Dilshan


Comments
Post a Comment