Anomaly Detection in Daily KPI Monitoring: A Data Engineering Perspective
Most KPI dashboards look simple at first glance. However, real production systems are rarely that straightforward. After detecting anomalies, the bigger challenge is understanding why the signal changed. This is where data engineering provides critical insight.
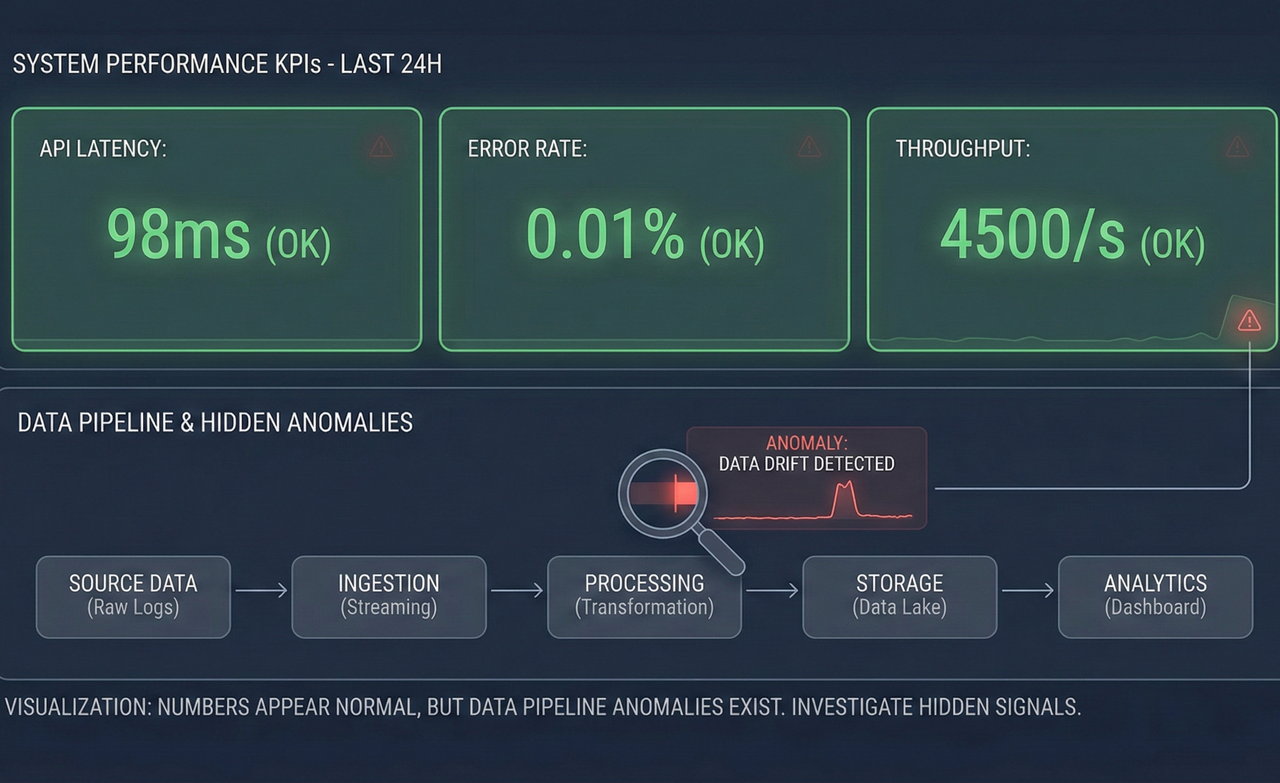
Understanding the KPI Signal
KPIs without context can be misleading. Time-series data is shaped not only by the system's behavior but also by pipelines, aggregation logic, and feature engineering.
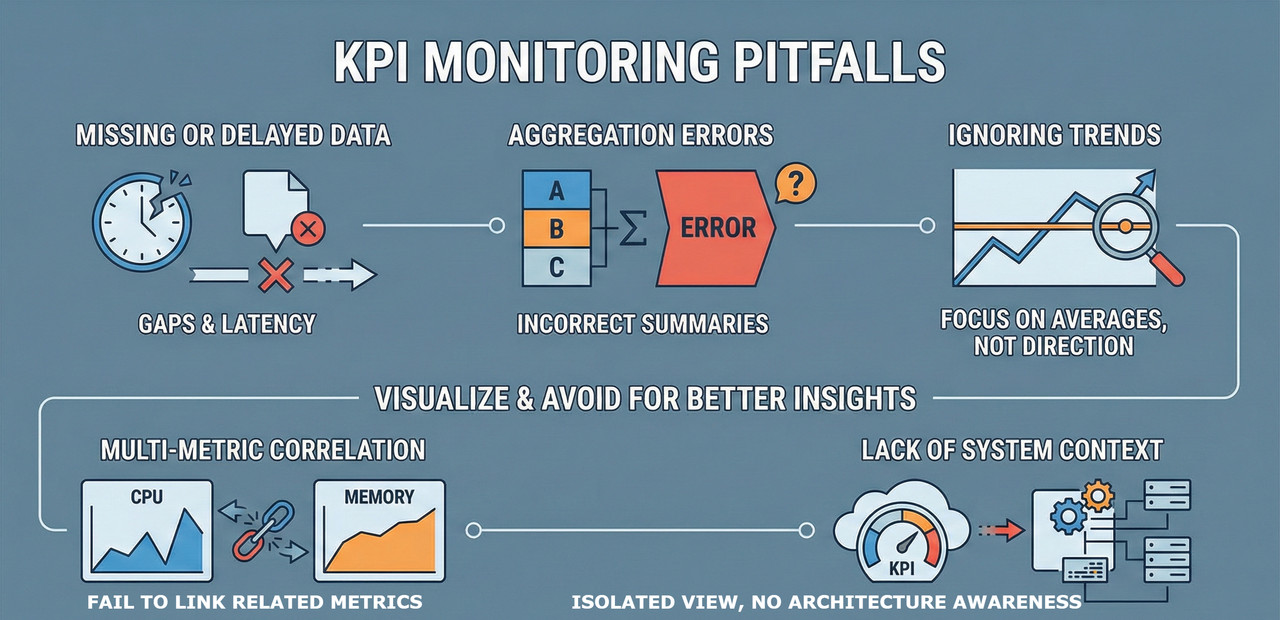
Common pitfalls in KPI monitoring:
- Missing or delayed data – Out-of-order events distort baselines.
- Aggregation without meaning – Averages hide variance and extreme events.
- Single-point KPIs – Ignoring rolling windows and trends hides important patterns.
- Lack of correlation analysis – Latency, throughput, and error rates are interdependent.
- No system context – Topology changes, traffic shifts, and deployments redefine what “normal” means.
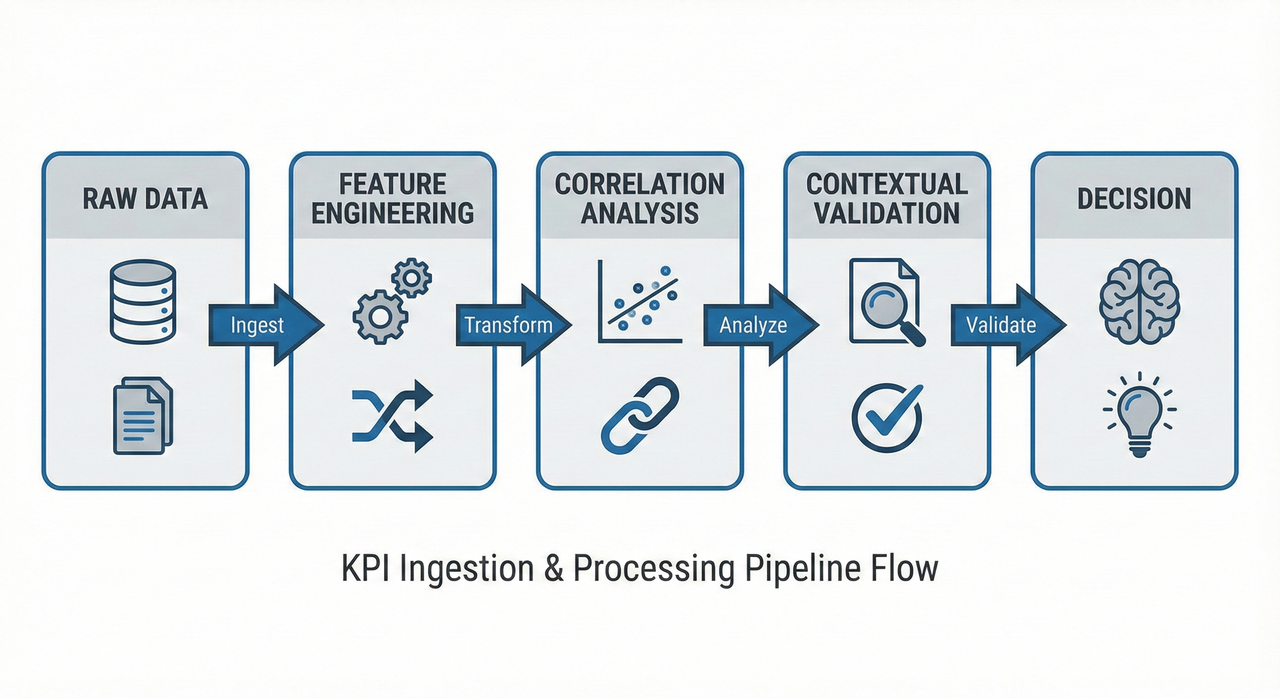
From Signal to Insight
Reliable KPI analysis requires:
- Deterministic ingestion and time alignment.
- Feature engineering using sliding and expanding windows.
- Multi-metric correlation, not isolated thresholds.
- Validation using system and domain context.
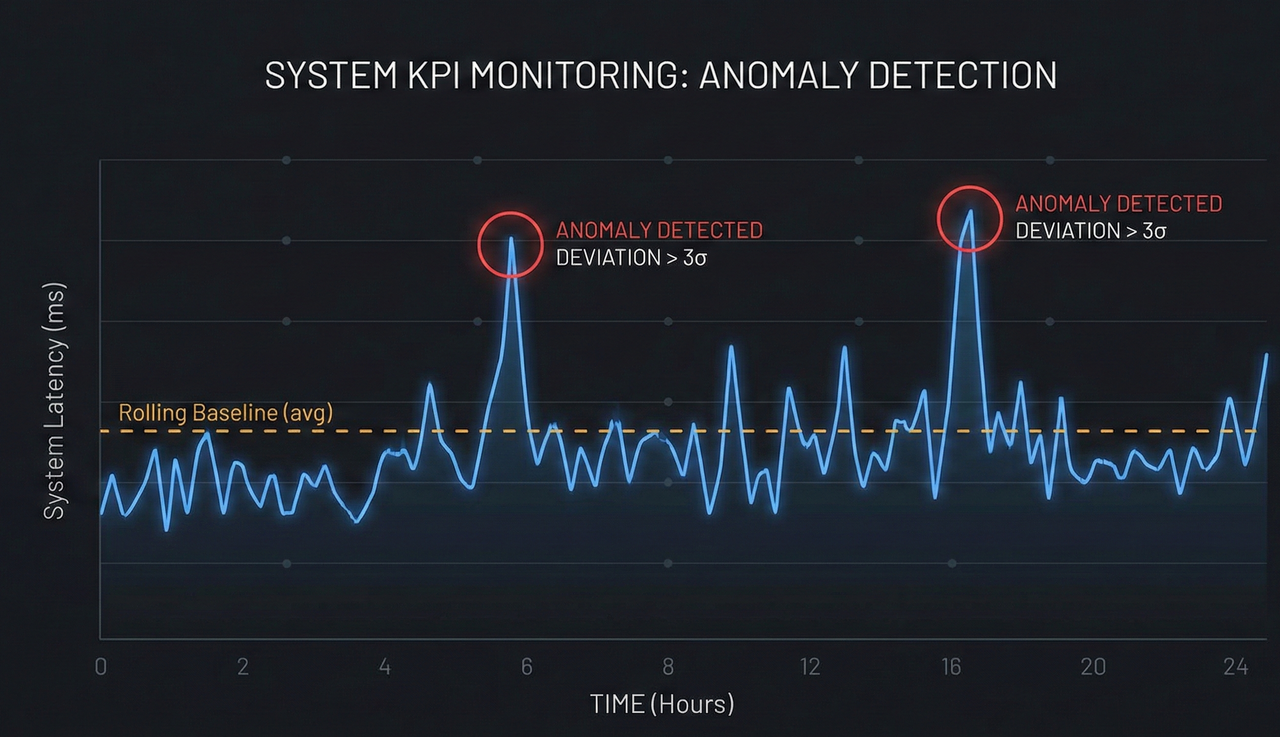
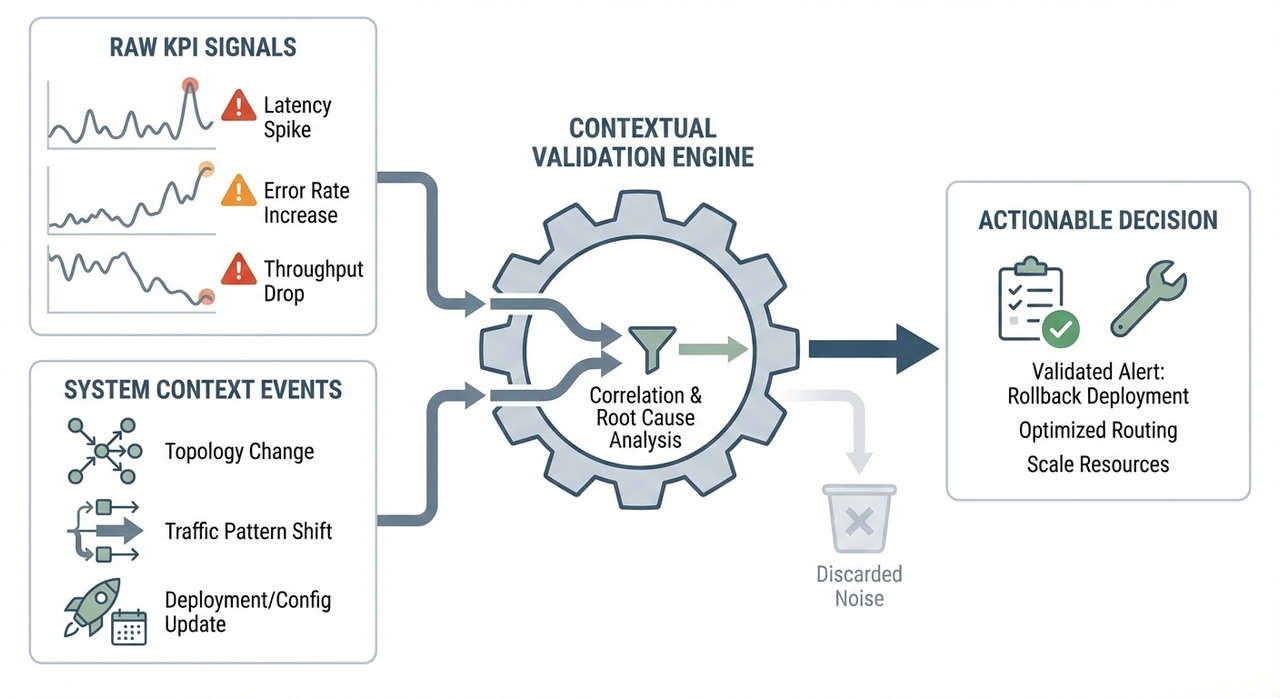
Anomaly Detection Alerts
Anomaly detection identifies that a change occurred. Data engineering explains what changed and why, turning signals into actionable insight.
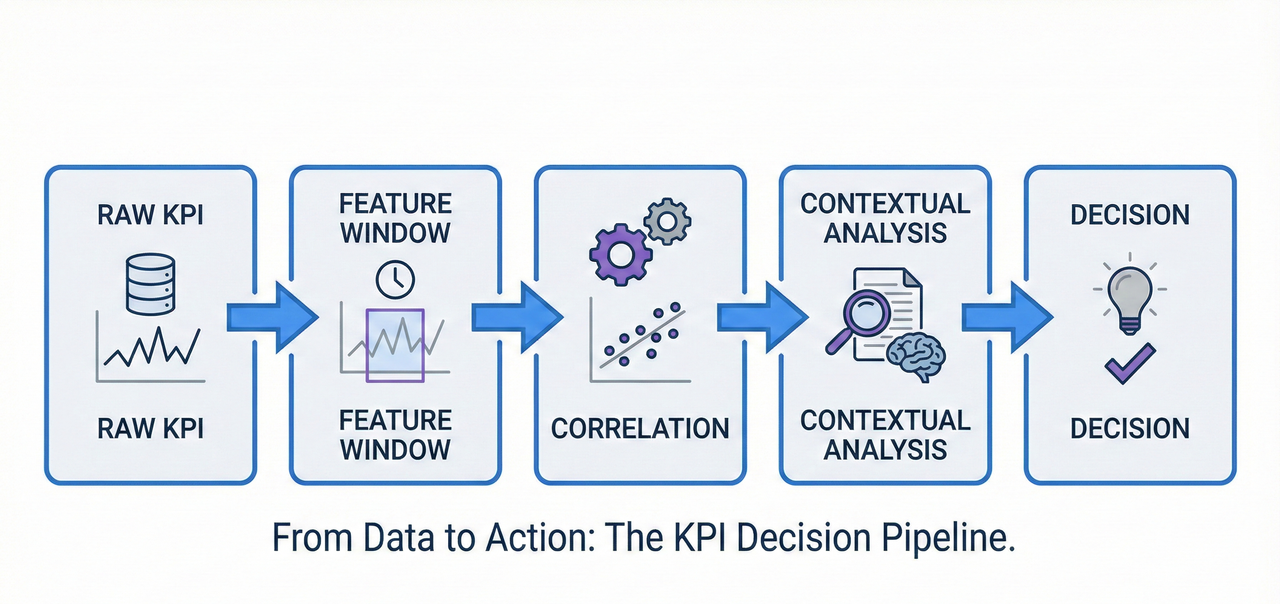
Turning KPIs into Decisions
Raw KPIs alone are not actionable. By combining clean data, feature engineering, correlation, and context-aware analysis, we convert numbers into informed decisions.
Conclusion
Effective anomaly detection is not defined by a single algorithm. It is a system-level process. When data engineering fundamentals, statistical reasoning, and domain expertise work together, KPIs evolve from passive metrics into early warning mechanisms and actionable intelligence.
– Pathum Dilshan


Comments
Post a Comment