Understanding Correlation, Covariance, and Related Concepts in Data
Have you ever noticed two variables moving together and assumed one causes the other? In real-world data systems, this assumption often leads to mistakes. Numbers can tell a story—but only if you understand the connections behind them.
Correlation vs Covariance: Direction vs Strength
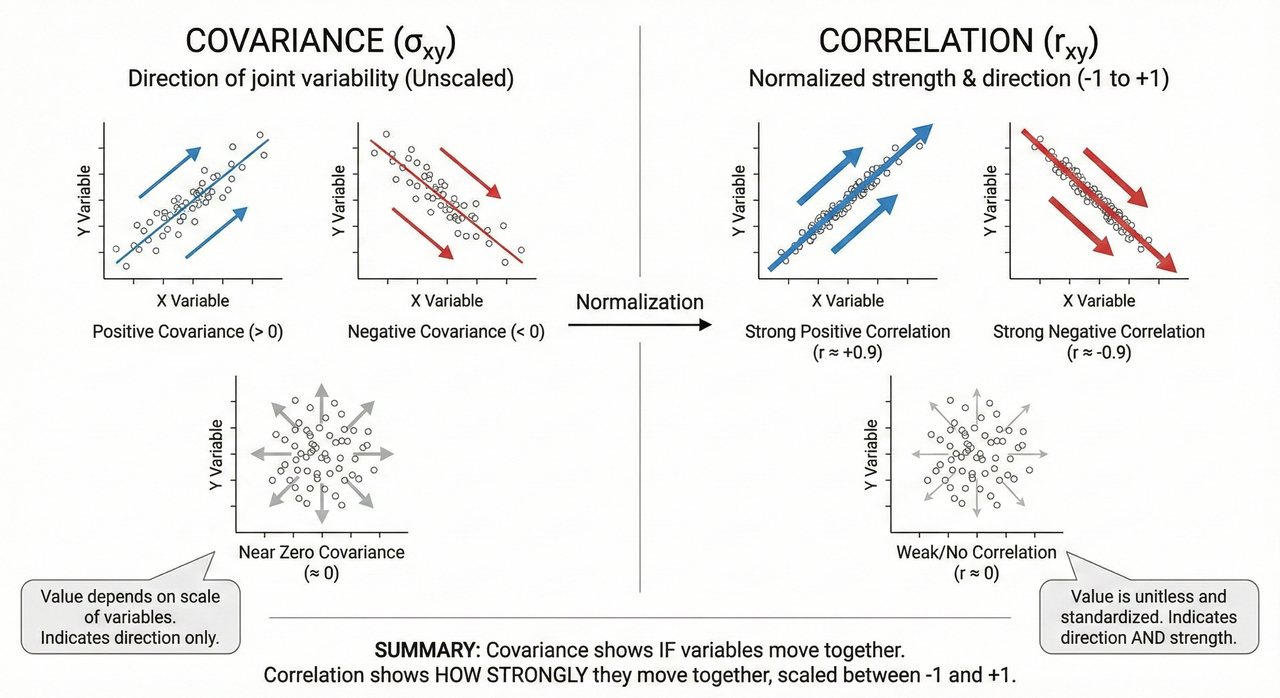
Correlation and covariance are fundamental concepts in statistics. Covariance measures how two variables vary together, but its magnitude depends on the units of measurement. Correlation normalizes this measure, providing a unitless value between -1 and 1 that indicates both direction and strength.
Key takeaway: Covariance tells you whether variables move together; correlation tells you how strongly.
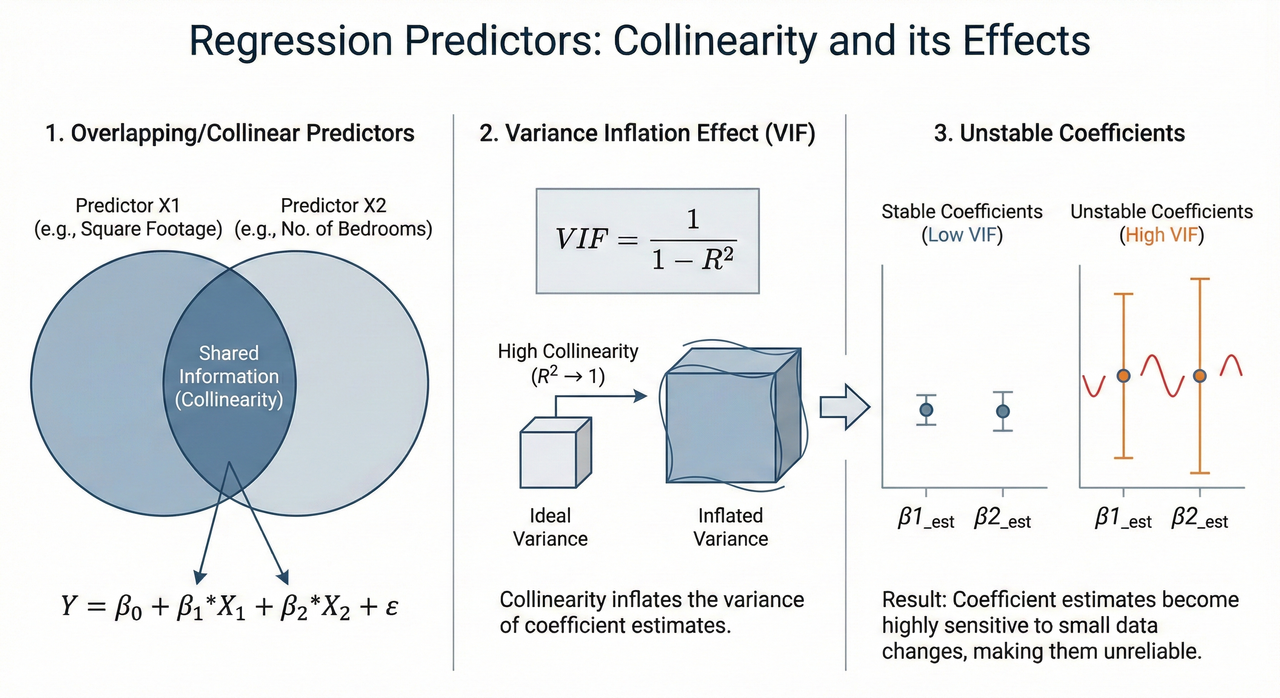
Collinearity: Overlapping Predictors
Collinearity occurs when two or more predictors in a model are highly correlated. While correlation is natural in data, collinearity can destabilize regression coefficients, inflate variance, and make models difficult to interpret. Identifying collinear variables early ensures robust model design.
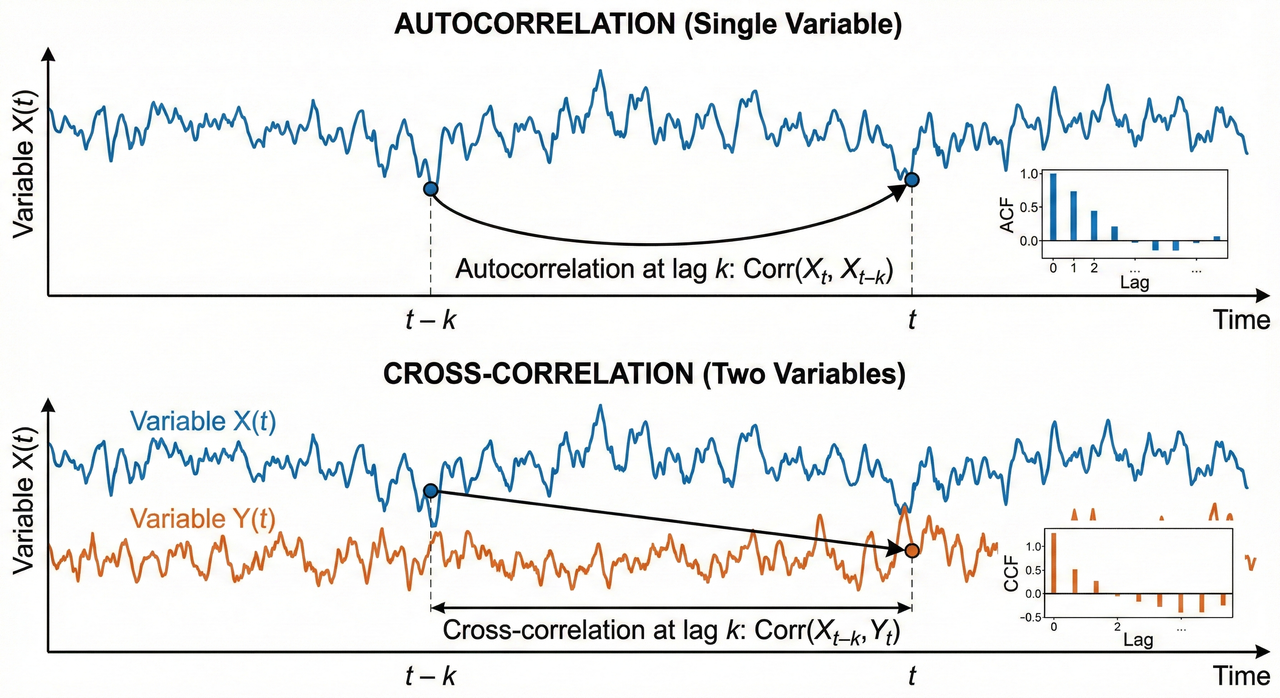
Autocorrelation & Cross-Correlation: Time Series Patterns
Autocorrelation measures how a variable relates to itself across time, revealing patterns such as seasonality or drift. Cross-correlation measures how two different variables relate over time, helping detect lead-lag relationships. These are essential tools in time-series analysis and forecasting.
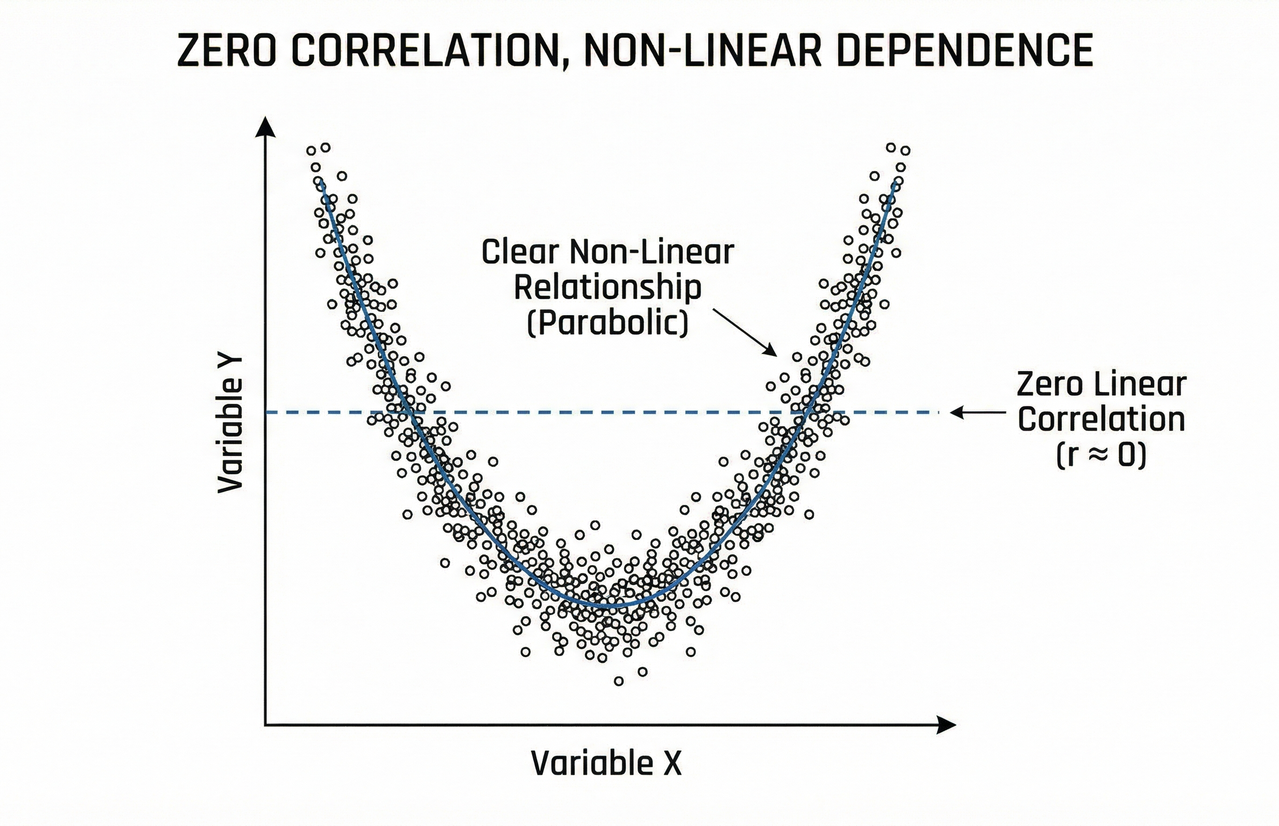
Zero Correlation ≠ Independence
A correlation of zero does not guarantee independence. Variables may have a non-linear relationship that correlation fails to detect. Always visually inspect data and consider higher-order dependencies to avoid false conclusions.
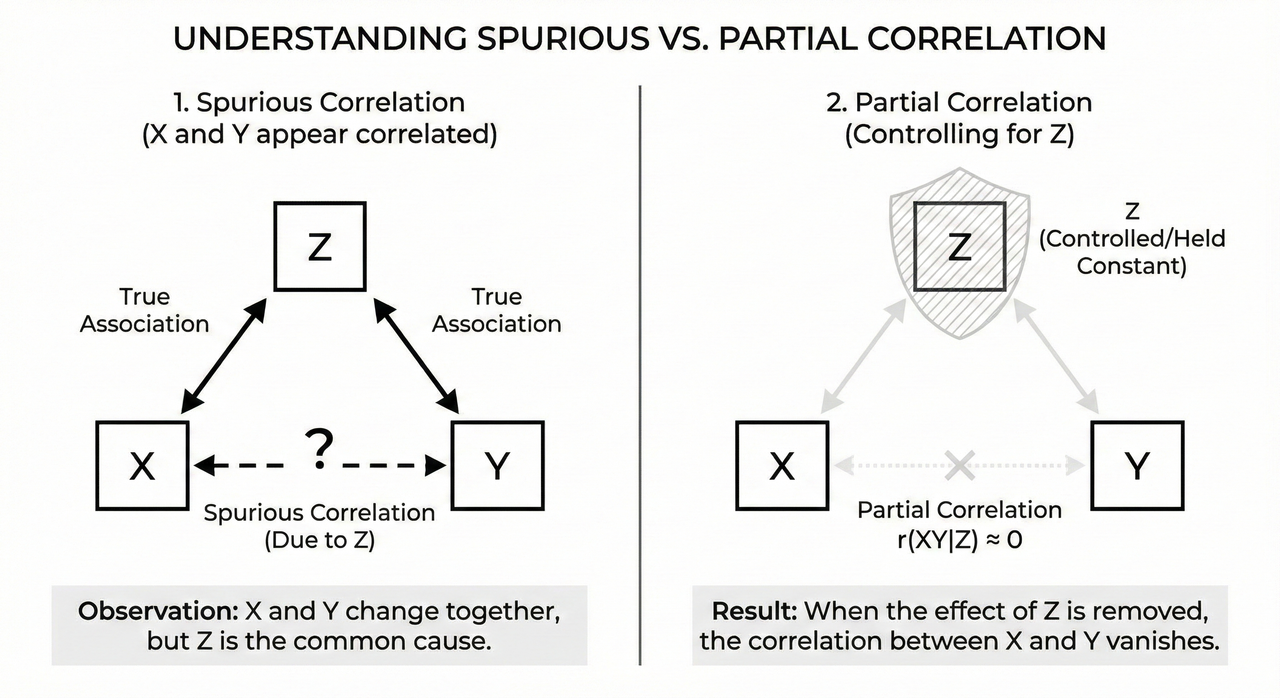
Spurious & Partial Correlation
Spurious correlations occur when two variables appear related due to a hidden factor. Partial correlation controls for such variables, isolating the true relationship. Understanding this distinction prevents false discoveries and misleading analyses.
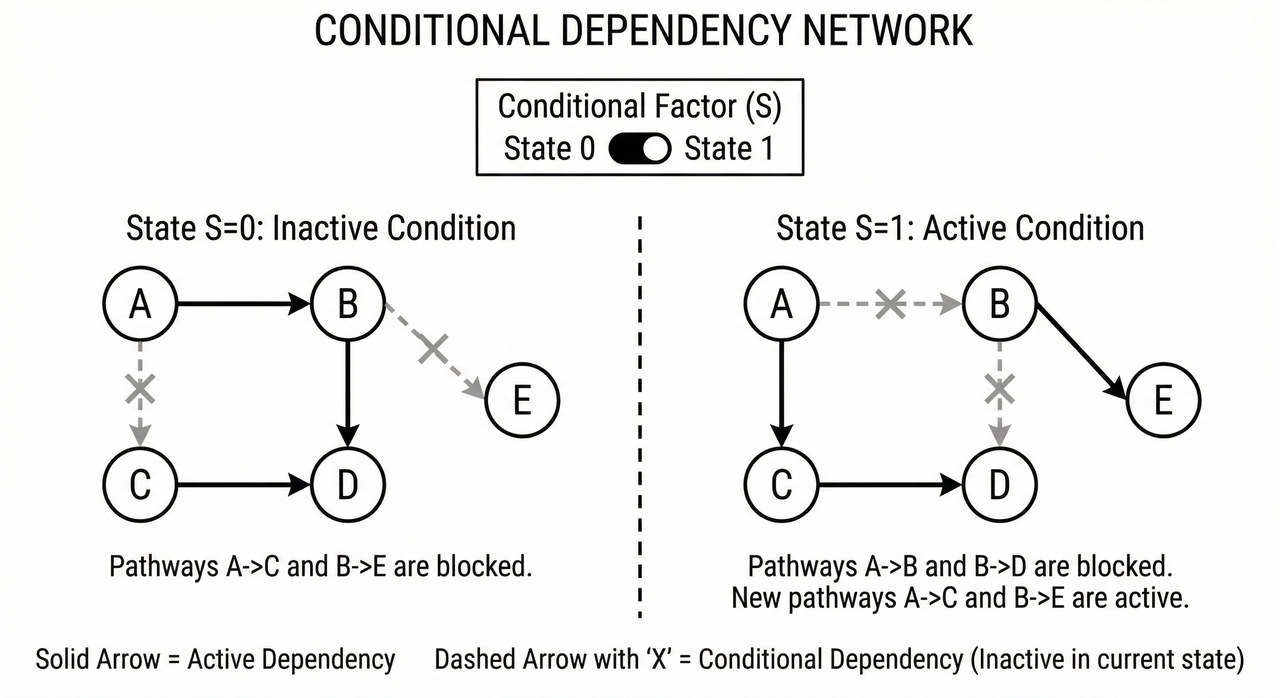
Conditional Dependence
Conditional dependence highlights that relationships may only appear when accounting for certain variables. Ignoring conditional dependencies can lead to erroneous causal assumptions in complex systems. This concept is particularly relevant in networked or multi-factor datasets.
Final Thoughts
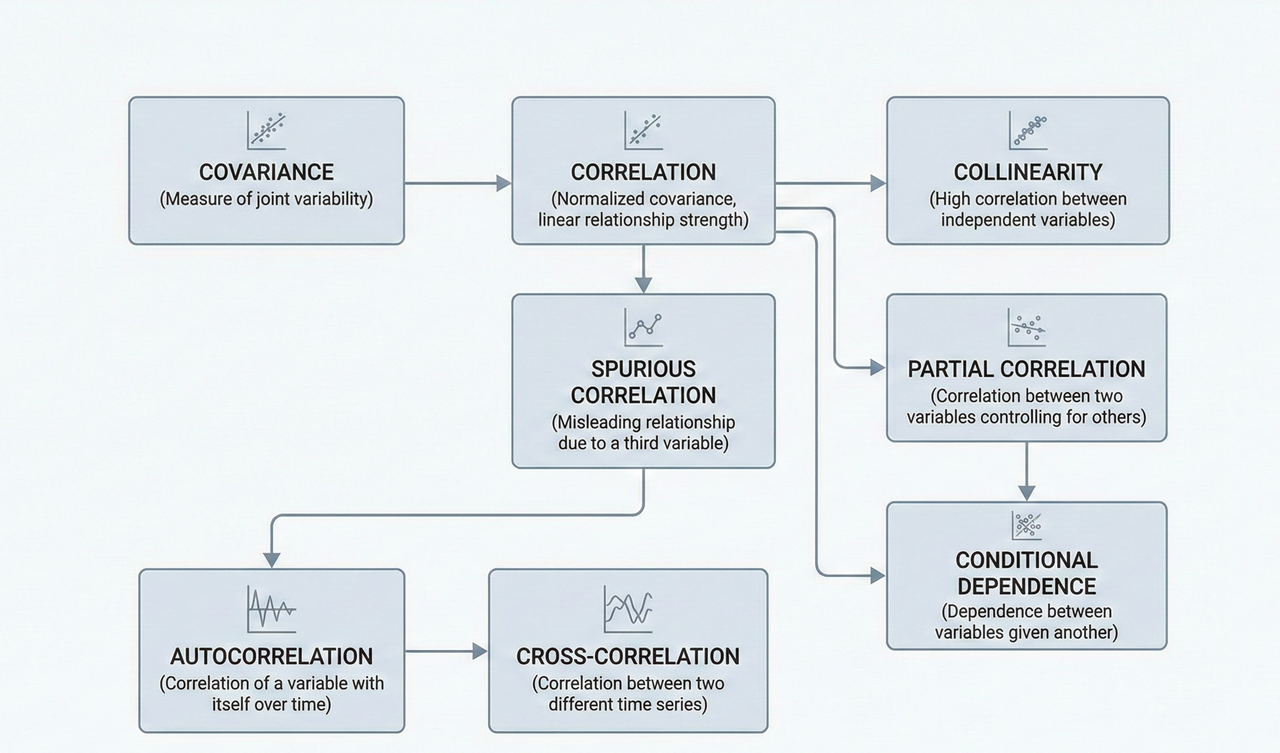
Data relationships are subtle, multi-layered, and often hidden. Understanding correlation, covariance, collinearity, autocorrelation, cross-correlation, spurious correlation, partial correlation, and conditional dependence is essential for robust analytics. Visualizing these concepts can make them more intuitive, inspire better decision-making, and prevent common pitfalls.
Special thanks to Dr. Uthayasanker Thayasivam for making these concepts approachable and demonstrating the value of visual explanations.
– Pathum Dilshan


Comments
Post a Comment